I looked into the mess a bit more, and as it turns out, the weird crap I was talking about only happens if you have a port with LossofSynchronization, LossofSignal or LinkFailures value with the base of ten (i.e. 10, 101 or 10.000).
Additionally, the OID’s for those three failure elements seem to be dependent on the firmware version, as with 6.3.x they appear as different OIDs. So I may need to introduce another command-line switch, which selects the firmware version and depending on that, the OID.
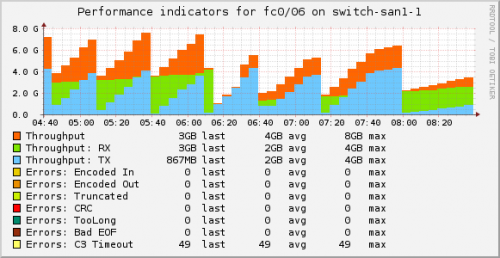
Even despite those problems I just described, I ended up using the plugin to watch our SAN infrastructure. I even wrote a simple pnp4nagios template, so all the data would show up in a single graph and not a graph per data source.

One thought to “Monitoring Brocade FC switches with SNMP/Nagios”