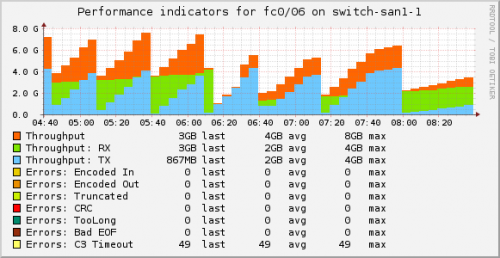
The last four days I spent looking for ways on monitoring a Brocade Fibrechannel switch (in my case IBM 2145 B32/F40). The first thing I came up with, is using SNMP. As it was already configured for the previous monitoring with Munin, getting information should be quite easy. After looking through Google for a bit, there is already one script that worked for me.
Only trouble I had with that script, is that it crams every single port into one result. As I wanted something, that a) could watch a single port and b) return performance data, I went ahead an used the script to do a basic rewrite. But after a short while, I grew antsy and started writing a script from scratch, using the OIDs I got from that script and a Cacti template.
So far, I got a good plugin, but it’s still lacking a few things:
- Support for warning/critical thresholds for each error category
- Sadly the important errors (er_link_fail, er_loss_sync and er_loss_sig) are kept in a separate table structure (swEndDeviceRlsEntry), which I can’t seem to access right now; even though the entries are mandatory and according to the MIB should be at least read-only.
- The plugin isn’t doing a proper $session->close(); . After moving the snmp stuff into a subroutine, Perl refuses to do the session closing. Don’t know why right now.
Right now, the plugin supports two modes. The first just checks if the port is operational and in sync and the second checks the port status, but also returns the performance data.
Only do a basic check if the Port is in operational status
|
|
./check_snmp_brocade_fcport.pl -H 10.0.0.50 -C public -P 2 -N SNMP_BROCADE_FCPORT OK - FC port 0/2's swFCPortPhyState is inSync |
Check the port status, but also return performance data
|
|
./check_snmp_brocade_fcport.pl -H 10.0.0.50 -C public -P 2 SNMP_BROCADE_FCPORT OK - FC port 0/2's swFCPortPhyState is inSync|stat_wtx=577976968;0;0;0;0 stat_wrx=4069984468;0;0;0;0 stat_ftx=422378205;0;0;0;0 stat_frx=123789748;0;0;0;0 er_enc_in=0;0;0;0;0 er_crc=0;0;0;0;0 er_trunc=0;0;0;0;0 er_toolong=0;0;0;0;0 er_bad_eof=0;0;0;0;0 er_enc_out=0;0;0;0;0 er_c3_timeout=0;0;0;0;0 |
That might look like much, but Nagios is gonna pass everything after “|” to your performance data command.
List of OIDs, which hold the various information:
1 2 3 4 5 6 7 8 9 10 11 12 13 14 15 16 17 18 19 20 21 |
swFCPort PhyState: .1.3.6.1.4.1.1588.2.1.1.1.6.2.1.3. OpStatus: .1.3.6.1.4.1.1588.2.1.1.1.6.2.1.4. AdmStatus: .1.3.6.1.4.1.1588.2.1.1.1.6.2.1.5. LinkState: .1.3.6.1.4.1.1588.2.1.1.1.6.2.1.6. TxWords: .1.3.6.1.4.1.1588.2.1.1.1.6.2.1.11. (stat_wtx) RxWords: .1.3.6.1.4.1.1588.2.1.1.1.6.2.1.12. (stat_wrx) TxFrames: .1.3.6.1.4.1.1588.2.1.1.1.6.2.1.13. (stat_ftx) RxFrames: .1.3.6.1.4.1.1588.2.1.1.1.6.2.1.14. (stat_frx) RxEncInFrs: .1.3.6.1.4.1.1588.2.1.1.1.6.2.1.21. (er_enc_in) RxCrcs: .1.3.6.1.4.1.1588.2.1.1.1.6.2.1.22. (er_crc) RxTruncs: .1.3.6.1.4.1.1588.2.1.1.1.6.2.1.23. (er_trunc) RxTooLongs: .1.3.6.1.4.1.1588.2.1.1.1.6.2.1.24. (er_toolong) RxBadEofs: .1.3.6.1.4.1.1588.2.1.1.1.6.2.1.25. (er_bad_eof) RxEncOutFrs: .1.3.6.1.4.1.1588.2.1.1.1.6.2.1.26. (er_enc_out) C3Discards: .1.3.6.1.4.1.1588.2.1.1.1.6.2.1.28. (er_c3_timeout) swEndDevice LinkFailure: .1.3.6.1.4.1.1588.2.1.1.1.21.1.1.4. (er_link_fail) SyncLoss: .1.3.6.1.4.1.1588.2.1.1.1.21.1.1.5. (er_loss_sync) SigLoss: .1.3.6.1.4.1.1588.2.1.1.1.21.1.1.6. (er_loss_sig) |
The last three OIDs, as well as the ones in FCMGMT-MIB (as I mentioned in the TODO), sadly don’t exist (or I’m doing something wrong ? — no clue right now), so I can’t incorporate them into the script at this time.
However, I found something in a separate OID-tree (also the FCMGMT-MIB), which seems to be exactly what I’m looking for.
|
|
connUnitPortStatCount LossofSynchronization: .1.3.6.1.3.94.4.5.1.44.16.0.0.5.30.52.240.185.0.0.0.0.0.0.0.0.<fcport> LossofSignal: .1.3.6.1.3.94.4.5.1.43.16.0.0.5.30.52.240.185.0.0.0.0.0.0.0.0.<fcport> LinkFailures: .1.3.6.1.3.94.4.5.1.44.16.0.0.5.30.52.240.185.0.0.0.0.0.0.0.0.<fcport> |
Only trouble with those OIDs is, that they are OCTET STRING’s, which right now just return crap (either nothing or just a new-line) with my script. Gonna have to work on that.
If you’re interested in the Perl script (for now, lacking some options, performance data, $session->close();), you’ll find it here.
