Converting TIVSM RPMs to deb

We received a preinstalled customer server the other day, for which we had declared “as-is” support only, since it is running Lucid Lynx. Now today, I started getting the TSM client to work. Was kinda weird, since at first dsmc was reporting something like this:

# ./dsmc: no such file or directory

After fiddling with it a bit more, here are the control files, as well as the prerm and postinst-scripts for TIVSM-API, TIVSM-API64 and TIVSM-BA:

tivsm-api/debian/control:

tivsm-api/debian/tivsm-api.postinst:

tivsm-api/debian/tivsm-api.prerm:

tivsm-api64/debian/control:

tivsm-api64/debian/postinst:

tivsm-api64/debian/prerm:

tivsm-ba/debian/control:

tivsm-ba/debian/tivsm-ba.postinst:

tivsm-ba/debian/tivsm-ba.prerm:

All that was left to do, was simply adding a -n to the dh_makeshlibs call in each packages debian/rules file, otherwise dh_makeshlibs would overwrite my shiny postinst/prerm actions!
VBscript: Query remote OS and SP info

As I wrote on Thursday, I am battling with Windows Server 2003. Now I got a list out of our change management database, which sadly ain’t that accurate. So in order to get reliable information about the target systems (in order to do some accurate planning), I ended up writing a small vbscript which simply takes the hostname on the command line (cscript //NoLogo win_sp_level.vbs 10.0.0.5) and returns a csv-like element.

We may have to tune the script a bit more for our use, but it should show the basic functions I need.

Windows Server 2003 SP1, WSUS and Security Updates

Recently, we found some systems (sadly, customer systems) that  weren’t getting any Security Updates anymore. Much more sadly, them is running Windows Server 2003, and as you know Security Updates are pretty important for Windows Systems.

At the time of finding this, I had no clue as to why the were not getting any updates. At first we thought it had something to do with the WSUS server, so I upgraded the WSUS 3.0 SP1 to SP2. Since that didn’t solve nothing, I went searching for a internal VM, that showed the same symptoms and I quickly found one.

After cloning said VM (since that one is running in the production environment), a bit of hacking on it (you know, disabling the network of the VM, switching IP and Hostname, running NewSID, …) I went cracking at the problem.

Stopped the Windows Update Service, cleaned the %WINDIR%SoftwareDistribution, and started the Windows Update Service again; triggered a wuauclt.exe /detectnow /reportnow. Yet again the same result. “0 updates detected”. Shite.

Went ahead, and tried what Microsoft in their “If you have trouble with Windows Updateknowledge base article, but then again. Same result.

Another try, was simply reinstalling the Windows Update Agent, which also resulted in the same old … “0 updates detected”

Due to some discussion with my co-workers, I ended up clicking through a Microsoft KB for a recently released patch. What I found, was that any newer update I looked at, only had “Windows Server 2003 with Service Pack 2” listed as download element. Shite.

Somehow, I stumbled over a link (in the same KB article) detailing the Support Lifecycle for Service Packs in general, as well as the Lifecycle announcements for each Service Pack.

End of the story and solution to my problem basically is, Microsoft terminated the Lifecycle for Windows Server 2003 SP1 on 14.04.2009, which is the target date after which Security and Critical Updates are no longer issued for systems running SP1.

In the end, I don’t really blame them, since SP2 was already released in 2007. But what I would’ve expected is some kind of press release or a public note, that Security releases are gonna end. Another construction area identified, more work for me!

VMware Data Recovery

I’ve been tinkering with VMware’s Data Recovery for the last two weeks (as in configured it some time before Christmas) and had it running all that time. I have to say the integration into the vCenter Client GUI is amazing, I’d love to see that for VCB also. The Changed Block Tracking is a neat way to minimize the amount backup data as well as your backup window (which is nearly zero anyhow due to vDR using snapshots).

What I don’t like about Data Recovery is the fact that you ain’t allowed supported to install any kind of backup agent inside. I  was looking into Data Recovery because I wanted to replace VCB’s functionality with something tightly integrated, that even our, well lets say — not so vCenter centered workers — could use (restoring a VM with vDR is real easy, just three clicks and you got a previous version of your VM — even if it has been deleted).

I guess, we do have to stick to Consolidated Backup for now, until VMware redesigns vDR or polishes VCB.

VCP410 exam

I’ve been learning for my VCP-410 exam the last week or so, and what can I say ? It helped … 463 points of a total of 500 points ain’t that bad at all (considering I spend twenty minutes doing it).

Sure, I could have spent more time, and do better than 92,6%, but then again: why should I ?

The achieved points (nor the percentage) don’t appear on the certificate (or at least it didn’t on the old one), so why bother. Anyway, that was my christmas present to myself, it that light; happy christmas ya’ll.

Monitoring Brocade FC switches with SNMP/Nagios

I looked into the mess a bit more, and as it turns out, the weird crap I was talking about only happens if you have a port with LossofSynchronization, LossofSignal or LinkFailures value with the base of ten (i.e. 10, 101 or 10.000).

Additionally, the OID’s for those three failure elements seem to be dependent on the firmware version, as with 6.3.x they appear as different OIDs. So I may need to introduce another command-line switch, which selects the firmware version and depending on that, the OID.

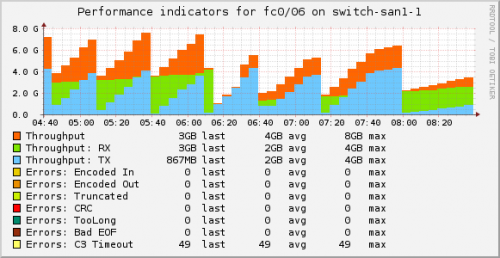
Even despite those problems I just described, I ended up using the plugin to watch our SAN infrastructure. I even wrote a simple pnp4nagios template, so all the data would show up in a single graph and not a graph per data source.

check_snmp_brocade_fcport Graph: 4 Hours

Monitoring Brocade FC switches with Nagios

The last four days I spent looking for ways on monitoring a Brocade Fibrechannel switch (in my case IBM 2145 B32/F40). The first thing I came up with, is using SNMP. As it was already configured for the previous monitoring with Munin, getting information should be quite easy. After looking through Google for a bit, there is already one script that worked for me.

Only trouble I had with that script, is that it crams every single port into one result. As I wanted something, that a) could watch a single port and b) return performance data, I went ahead an used the script to do a basic rewrite. But after a short while, I grew antsy and started writing a script from scratch, using the OIDs I got from that script and a Cacti template.

So far, I got a good plugin, but it’s still lacking a few things:

  1. Support for warning/critical thresholds for each error category
  2. Sadly the important errors (er_link_fail, er_loss_sync and er_loss_sig) are kept in a separate table structure (swEndDeviceRlsEntry), which I can’t seem to access right now; even though the entries are mandatory and according to the MIB should be at least read-only.
  3. The plugin isn’t doing a proper $session->close(); . After moving the snmp stuff into a subroutine, Perl refuses to do the session closing. Don’t know why right now.

Right now, the plugin supports two modes. The first just checks if the port is operational and in sync and the second checks the port status, but also returns the performance data.

Only do a basic check if the Port is in operational status

Check the port status, but also return performance data

That might look like much, but Nagios is gonna pass everything after “|” to your performance data command.

List of OIDs, which hold the various information:

The last three OIDs, as well as the ones in FCMGMT-MIB (as I mentioned in the TODO), sadly don’t exist (or I’m doing something wrong ? — no clue right now), so I can’t incorporate them into the script at this time.

However, I found something in a separate OID-tree (also the FCMGMT-MIB), which seems to be exactly what I’m looking for.

Only trouble with those OIDs is, that they are OCTET STRING’s, which right now just return crap (either nothing or just a new-line) with my script. Gonna have to work on that.

If you’re interested in the Perl script (for now, lacking some options, performance data, $session->close();), you’ll find it here.

PXEBoot the VMware ESXi installer

Some of you may know, that VMware released vSphere 4.0 Update 1 yesterday. I took this as a reason, to finally wrap my head around booting the VMware ESXi installer from my PXE/TFTP box. Since VMware was kind enough to provide (a somewhat worthless) document, that explains how to extract the necessary files on Windows. But that quite doesn’t work with Linux — and VMware just states that you should be using mount and it’s option offset.

Luckily there are smart people around. Cameron shows exactly as to how you’d mount the dd-image. If the dd-image is mounted, you just need to copy over cim.vgz, license.tgz, oem.tgz, sys.vgz, vmk.gz and vmkboot.gz. After doing so, you should add a section to your pxelinux.cfg that kinda looks like this:

Just make sure, everything following APPEND and before IAPPEND is in a single line.

Configuring nagios-plugins-zypper

Since I’m running check_zypper via nrpe (which in turn runs as nobody), I need to set up sudo. In order for the plugin to work, we need to add the following line to /etc/sudoers (by means of visudo):

(Keep in mind this needs to be a single line …)