Nagios: NSclient++ in a clustered Environment

Well, most of you already know that I’m a Nagios fanatic. I like to watch as many aspects as I possibly can. So, yesterday I started figuring out ways to watch our different cluster groups (housing a bunch — try above 20.000 — of file shares).

Now, my first tries failed horribly. I brought down a complete cluster group, resulting in a major annoyance. Now, today I went at it a bit smarter ๐Ÿ˜› I cloned myself two VM’s off my Windows Server 2003 Enterprise R2 template, created a new cluster.

After that, I tried it on the test cluster again, same result. The resource is successfully created, but once I try to take it online, it breaks and moves the whole cluster group to the other node (as cyclic moving between the cluster nodes with no end).

After that, I figured something has to be wrong with the command I’m trying to use, the one as instructed by the NSClient++ wiki. I then tried the command on the command line, but as soon as hitting <TAB> (oooold bash habit ๐Ÿ˜› ), it completed the path, but put quotes around it … Don’t ask me.

If I try the path without the quotes, no-joy at all. Once you put quotes around it, everything becomes honky-dory and the resource comes online without the slightest trouble!

Hint to self: When creating a NSClient++ cluster resource (or any application resource using a command that needs switches for that matter), use a quoted command line along the lines of this:

Nagios: Integrating Cisco switches

Well, as I wrote recently, we received a new BladeCenter a few weeks back. Now, as we slowly take it into service I was interested in watching the utilization of the back planes as well as the CPU utilization of the Cisco Catalyst 3012 network switches.

The first mistake I made, was to trust Cisco with their guide about how to get the utilization from the device using SNMP. They stated some OID’s, which I tried with snmpwalk and got a result from.

Now, as I tried retrieving the SNMP data by means of the check_snmp plugin, I got some flaky results:

Those of you, who read the excerpts carefully will notice the difference between snmpwalk and the OID I passed on to check_snmp.

The point being, the OID’s Cisco gave in their Design tech notes are either old, or just not accurate at all. After passing on the .0 to each value given by Cisco, the check_snmp is all honky dory and integrated into Nagios.

As usual, the Nagios definitions are further down, for those interested. Read More

Monitoring the IBM BladeCenter chassis with Nagios

Today I ended up working out the details on what we want to monitor regarding our BladeCenter. The most interesting details (for us that is) are these:

  • Fan speeds for Chassis Cooling/Power Module Cooling Bay(s)
  • Temperature
  • Power Domain utilization

It wasn’t *that* hard to implement. Only trouble(s) I ran into, were (1) IBM did a real shitty job with the MIB’s. If you look closely into the mmblade.mib, you’re gonna notice, that not a single OID is specified for the events. (2) As the MIB’s weren’t documented anywhere, I had to look them up via snmpwalk (which I had never used before). So as a reminder (to myself), here’s how it is done:

This will get you a list, with a lot of output (5154 lines to be exact). Lucky me, the web interface of the management module/ssh interface is rather verbose, so all you need to do is compare those values with what you are looking for.

So for myself (and anyone interested) read ahead for the list of checks we are currently running on the management module. Read More

Opsview installation reviewed

Well, I recently (well, yesterday) built the opsview RPM’s for SLES10, and started fiddeling about with it today. Alex “recommended” I should rather look at Opsview instead of Centreon, but boy was there a surprise waiting for me …

Opsview has the advantage that it at least lets you use the package manager. But, it also needs *a lot* of handy work (just like Centreon, which I really dislike since it’s real error prone).

I started doing the setup, but gave up halfway through … โ— Dude, and they expect people to pay money for training ?!?

I mean, come on .. you can do a better job at making this thing fit a bit better into the system, and even make the install a bit more straight forward.

Nagios and check_ram yet again

As some people know, I previously “created” (mostly modified the check_swap plug-in to print RAM usage) check_ram in C. Now one of my problems for the past few months was putting the C plug-in as well as “supported” environment under the same hat. Today I had another look at the amount of available plug-ins in NagiosExchange. There are quite a few plug-ins available, but as I do have some experience with Python, I used the one written in Python.

It was rather easy hacking in support for performance data into it, as the below shows. Someone else already posted a non-unified diff for performance data support, but that ain’t quite right according to the Nagios plug-in development guidelines.

Read More

MessPC Ethernetbox 2 and Nagios

As I talked to Tobi yesterday, we came to talk about our Ethernet Box thermometer. It’s a neat device, which works pretty much out of the box. Integrating it with Nagios is a bit of a bummer.

Ethernetbox 2
Ethernet box 2

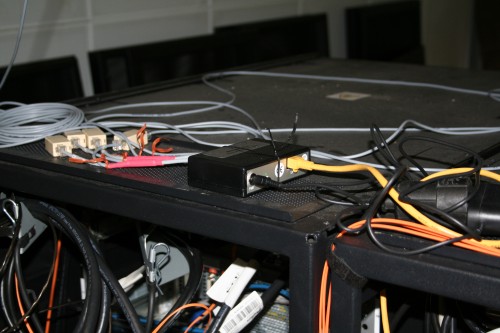
That’s what the ~300 EUR box looks like. It’s basically a small black box with a RJ45 jack, and four RJ11 jacks for attached external devices. The box itself only functions as a “management station” and doesn’t come with a sensor.
Normally, you can attach up till four RJ11 sensors to it. But, MessPC also has RJ11 port splitters, which enables you to attach up to eight RJ11 sensors to the MessPC.

Thermometer RJ45 jacks

As you can see, the box has a RJ45 jack on the other side, which you basically hook up to your network and then configure an IP address (or if you fancy DHCP for those things, it’s possible too).

Thermometer RJ11 jacks

On the opposite site, are the RJ11 jacks for the sensors. As you can see, we currently do have 4 splitters attachted to the box, enabling up till 8 sensors to be measured.
Once you have it up and running, you can look at the web interface and you’ll be able to see the state of the sensors right on the first page.
Read More

Suspected NRPE weirdness

Well, I just noticed a really weird thing, when you have command line arguments enabled.

Here’s a snippet from my nrpe.cfg:

Now, if you’d check the free space for the root, it ain’t gonna show any inode percentage (that one isn’t what I’m talking about). But if you have to use bind mounts like I do (Tivoli needs a separate “domain” — that is a separate mount point for each domain), you might wanna check the free space on the *real* device, rather than the free space on the bind mount (which is gonna show you the free space of the parent file system – in my case the root fs).

Let’s take a look at what I’m talking about. If you use the check_disk locally like this:

Means, everything is okay, you have to pass the extra trailing slash to the –partition argument, as otherwise it would pick up the bind mount at /backup.

Now, if we do the above by means of NRPE, that’s gonna get you a different result. As I showed above, I have the check_disk command in my nrpe.cfg, I also specifically enabled command arguments during compile time.

Now, why the hell isn’t it picking up the *original* mount point of the file system ? Guess why … Because I added -E to the command, because it didn’t use the original mount point but rather the bind mount in /backup. Removing the -E and it picks up the *original* mount point without any trouble *shrug*.

Nagios 3 and hostgroup inheritance

As I wrote some time ago, I was trying to utilize Nagios 3.x’s neat feature of “nested” hostgroups. Well, as it turned out I thought it worked differently; basically like this:

As you can cleary see on line 14, I thought you define the relation between two hostgroups in the child hostgroup. The problem with it was basically (as I said in the earlier posts), that all the services defined for the child hostgroups are handed on upwards to the parent hostgroup(s).

But after talking to Tobi, I quickly found out, that the relation is in fact defined within the parent hostgroup. So if you simply put hostgroup_members within the parent hostgroup and define all child hostgroups which should inherit from the parent one, you should be just fine.

Nagios Hostgroup Inheritance (continued)

Well, it turns out that my thought was ultimativly flawed. When defining the hostgroup_members in the lower tiers, nagios is association the checks from the lower tier with the upper tiers. Thus propagandating all checks upwards, and me ending up with ~250 checks instead of ~150.

Gonna have to try to define the dependency backwards, maybe that’ll help. But that’s a topic for Monday. Guess I’ll finish viewing Ghost in the Shell – Stand Alone Complex first.

Nagios Hostgroup Inheritance

As I wrote earlier, I recently virtualized our nagios. Along with that came a complete “redesign” of how checks are applied. Up till now, I defined checks for each and every single server, thus ending up with ~25 files, each holding roughly 6 checks which are in the same file just sorted by hostname.

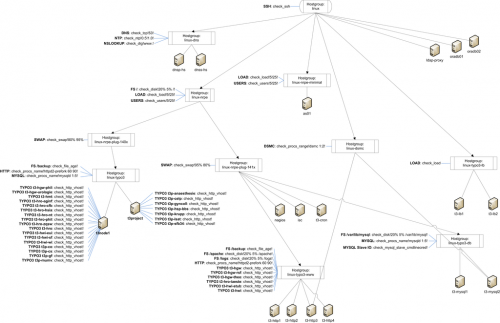
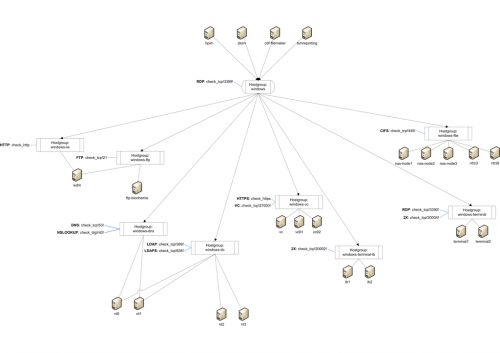
As you can imagine, it gets quite confusing with that amount of checks (~150). So the last two days I spent on reorganizing (with Visio), on which object/hostgroup placing a check would make sense. Now, this is my first result of two days planning, reorganizing, reordering and moving hosts into different hostgroups.

Nagios Hostgroup Inheritance - Linux
Nagios Hostgroup Inheritance – Linux
Nagios Hostgroup Inheritance - Windows
Nagios Hostgroup Inheritance – Windows
Thanks to Josh (and Chris I think), realizing the above is gonna get quite easy. Gonna talk about the config layout itself about once I have it all wrapped up. Stay tuned!