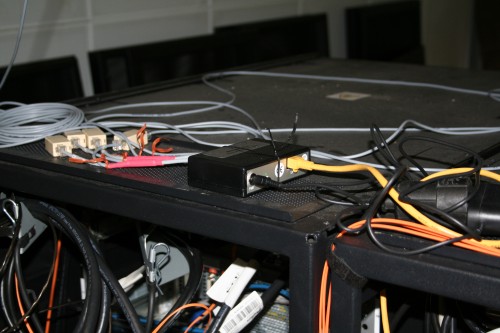
As I talked to Tobi yesterday, we came to talk about our Ethernet Box thermometer. It’s a neat device, which works pretty much out of the box. Integrating it with Nagios is a bit of a bummer.

That’s what the ~300 EUR box looks like. It’s basically a small black box with a RJ45 jack, and four RJ11 jacks for attached external devices. The box itself only functions as a “management station” and doesn’t come with a sensor.
Normally, you can attach up till four RJ11 sensors to it. But, MessPC also has RJ11 port splitters, which enables you to attach up to eight RJ11 sensors to the MessPC.

As you can see, the box has a RJ45 jack on the other side, which you basically hook up to your network and then configure an IP address (or if you fancy DHCP for those things, it’s possible too).

On the opposite site, are the RJ11 jacks for the sensors. As you can see, we currently do have 4 splitters attachted to the box, enabling up till 8 sensors to be measured.
Once you have it up and running, you can look at the web interface and you’ll be able to see the state of the sensors right on the first page.
Now, if you have a Nagios installation (like I do), you might want to integrate the Ethernetbox with Nagios.
You do have two choices: either do the checking by means of SNMP but forego graphing by Nagios, or use check_pcmeasure and use the full features of your Nagios installation (read: graphing done by pnp4nagios).
As I recently updated our Nagios installation to 3.0.4, I ran into trouble with the pcmeasure plugin. It simply didn’t run with the embedded perl (which it should, but apparently became a bit stricter between 2.x and 3.x). So I went ahead and changed it, so it would run with embedded perl, as I was in the mood.
After that was done, I simply dumped it into /usr/lib/nagios/plugins on my nagios box,
created a /etc/nagios/objects/commands/etherbox.cfg containing the necessary command definition:
|
1 2 3 4 5 |
# 'check_ethernetbox' command definition define command{ command_name check_ethernetbox command_line /usr/lib/nagios/plugins/check_pcmeasure.pl -H $HOSTADDRESS$ -S $ARG1$ -W $ARG2$ -C $ARG3$ } |
Now we can go ahead and *really* integrate it into Nagios, by simply creating a host utilizing this command definition.
|
1 2 3 4 5 6 7 8 9 10 11 12 13 14 15 16 17 18 19 20 21 22 23 24 25 |
define host { use generic-network host_name ethernetbox alias ethernetbox.home.barfoo.org address 10.0.0.9 parents home-0 } define service { use generic-service host_name ethernetbox service_description 1.1: Aussentemperatur check_command check_ethernetbox!com1.1!29.0!35.0! action_url /pnp/index.php?host=$HOSTNAME$&srv=$SERVICEDESC$ notes View PNP RRD grap } define service { use generic-service host_name ethernetbox service_description 1.2: Druckfussboden check_command check_ethernetbox!com1.2!16.0!19.0! action_url /pnp/index.php?host=$HOSTNAME$&srv=$SERVICEDESC$ notes View PNP RRD grap } |

One thought to “MessPC Ethernetbox 2 and Nagios”